Market Report
U.S. Offshore Wind
Emerging Opportunities and Challenges of the US Offshore Wind Market
As of end September 2021, there were at least 45 offshore wind projects in development representing a $142.5bn CAPEX and $4.8bn annual OPEX opportunity
By Philip Lewis IMA/WER
Much has changed in the US wind market in 2021.
Despite being the second largest market for onshore wind, accounting for over 16% of the global market, the United States is today a minor player in offshore wind in comparison to the European and Asian offshore wind markets. The US market accounted for less than 1% of the global offshore capacity figure at the end of 2020.
Global offshore wind capacity reached 32GW of installed capacity by the end of 2020 – produced from over 7,300 predominantly bottom-fixed wind turbines. Two operational projects of seven offshore wind turbines with a nameplate capacity of 42MW has been the contribution of US wind to the global offshore wind total.
After several false starts, the US offshore wind market development continues to pick up speed in 2021. A major federal OCS project has reached FID, nine federal OCS projects are under final review, 14.3GW of project capacity has secured offtake commitments from East Coast states, 16.6GW of new federal leasing activity in the northeast, South Atlantic and California is underway, turbine component, foundation, and cable factories are being built in the US, and offshore wind port development is accelerating.
The project development pipeline now stands at close to 47GW.
Ports, fabricators, component manufacturers, vessel operators, engineering firms and lenders will benefit from the $142bn CAPEX, $4.8bn annual OPEX, and $21bn DECEX opportunity.
These are the findings shared in a recent report on the US offshore wind by World Energy Reports (WER).
The 100+ page report examines the business conditions likely to drive offshore wind project development in the US within this decade, forecasts the number, CAPEX, OPEX and timing of projects, and provides a roadmap to accessing these market opportunities.
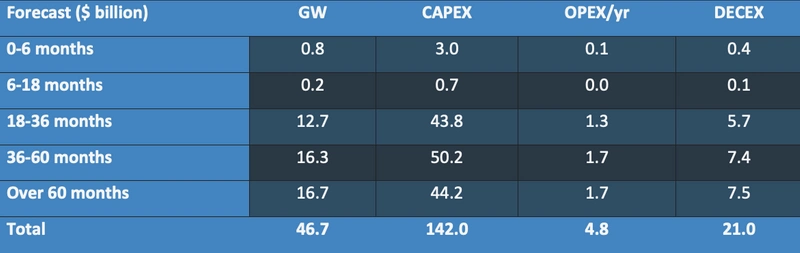
Summary Forecast for US Offshore Wind Projects by Final Investment Decision Timing
Setting the Scene
Dozens of countries including the US have announced ambitions to transition to “net zero” by 2050 – meaning achieving Paris Agreement goals to limit global temperature rise to 1.5oc and bring CO2 emissions to net zero -- or in simple terms decarbonizing the economy. To decarbonise the economy not only means how we produce electricity but all aspects of transport, heating, industrial processes, and consumer behaviour.
Focusing on electricity generation, last year slightly over 60% of the US’s electricity was produced from oil, gas, and coal – where the use of natural gas is growing as coal demand falls. Nuclear accounted for an additional 19%. Nuclear is relevant as this is also another baseload technology that is currently being challenged. This means an energy transition towards net zero is effectively a transition away from 60-80% of US baseload electricity generation capacity at the same time as they plan to increase our baseload electricity supply as the economy is electrified.
Onshore wind currently accounts for around 9% of US generation capacity – with a capacity of around 120GW.
According to forecasts by the US Energy Information Administration (EIA), fossil fuel in the electricity generation mix will fall to 53% and nuclear to 15% by 2030 as the share of renewables increases to 32%. Natural gas is forecast to account for around 35% of all electrical generation capacity by 2030 – a reflection on the need to secure baseload electricity generation power.
A key challenge of the main renewable energy source, wind and solar, is that the wind does not always blow and the sun does not always shine. As a result, renewable energy supplies are variable technologies – which pose a challenge to securing baseload energy supply.
As a result, the industry is working on solutions to address variability. For wind, this means moving wind turbines offshore where wind speeds are more constant and coupled with the deployment of the largest wind turbines, achieve higher capacity factors than onshore turbines. It also means adding the ability to store power – either through the deployment of battery systems or through the conversion of wind to an energy carrier, such as hydrogen, which can be stored and used when needed. Much of this technology is at the early stage of development – but these technologies will play a key role in supporting the growth of offshore wind as a variable baseload technology.
The Drivers for Offshore Wind Growth in the US
The US has a quantified offshore wind net commercially feasible resource at 2,060GW in 29 states along the Atlantic, Pacific, Gulf of Mexico, and Great Lakes coasts. This is almost two times today’s total electricity generation capacity.
The US federal government is one of many who have established offshore wind targets amounting to over 270GW of global offshore wind capacity by 2030 -- 30GW in development by 2030 in the case of the US and 110GW by 2050. These targets aim to increase confidence in the supply chain to develop the capacity and competency to deliver on these targets.
In the US, it is the states that drive procurement of offshore wind, through renewable energy goals and specific offshore wind procurements. Till now 4GW of state offshore wind targets have been set – with 14.3GW of capacity already procured.
State Activities
It is the federal government’s role to award and administer offshore wind leases and to permit developer construction and operations plans (COPs) -- which establish the design envelope for a project. Only once a project is permitted can a developer construct a project to deliver power secured through state procurements.
BOEM, the central federal administration agency for US offshore wind, has permitted one project for 804MW and is progressing the review or planning to commence review on COPs for developments amounting to over 15GW. Over the last eight months, the pipeline of projects under federal permitting review has increased and the timelines for project approvals have become clearer – which provides an indication for developers to plan a final investment decision (FID) and offshore construction.
Federal Permitting Targets
A 46.7MW Project Forecast
As of end September 2021, there are 19 projects for close to 14GW which are post-FID or where a final investment decision is expected within the next 36 months. This is made up of large projects in the federal administered waters (OCS) as well as floating wind technology demonstrators in the Great Lakes, the Atlantic and the Pacific.
Over 31GW of federal Atlantic and Pacific offshore wind potential has been identified – but has yet to progress to the COP stage. This capacity will provide the supply chain demand through the next decade.
Site assessment work continues for another eight east coast projects with around 9GW of project potential. Around 5GW of additional potential is in leases already awarded, where site assessment work has yet to commence. BOEM is advancing plans to lease up to 9.8GW in New York Bight offshore wind leases through 2022, as well as 4.6GW of floating wind leases in California and 2.2GW in the Carolinas.
Most of the planned activity in the Atlantic is bottom-fixed wind. However, plans are well underway to develop a demonstration floating wind turbine each in Maine and Massachusetts and pilot arrays consisting of several turbines in Maine and California. These projects will be essential to address the unique challenges posed by floating wind projects – which require a different construction process to bottom-fixed wind.
A $142bn CAPEX and Annual $4.8bn OPEX Opportunity – But Some Supply Chain Challenges
Our bottom-up forecast model breaks the $142bn of CAPEX into component spend.
We are forecasting close to $113bn to be spent on material supply, manufacturing and/or fabrication of turbines, cables, foundation structures and other equipment.
We anticipate around $25bn will be spent on installation and commissioning activities.
Based on COP details and developer announcements, US project activity will be at a peak from 2023 to 2026. This will coincide with a spike in bottom-fixed project activity in Europe and East Asia – and increase competition for limited supply chain resources. 2025 and 2026 is a peak year for international project commercial operations (COD) – based on projects already permitted or in the permitting process.
East Asian, European and US Project Activity by COD
To manage this, certain US developers are clustering projects to better plan resources. Our report analyzes the various project clusters.
An additional constraint that the developers of US wind projects must consider is the Jones Act.
In Europe, the practice has moved to large purpose-built turbine (WTIV) and foundation (WFIV) installation vessels – that shuttle to and from a turbine or foundation factory or marshalling port to the work site. Only one US Jones Act is currently being built. Demand is the US will exceed five vessel years for WTIVs and WFIVs in each year from 2025-2026.
The global fleet of high-spec vessels WTIVs sufficient to install the large turbine and foundations planned for US projects will stand at 16 by 2025. Six to seven of these WTIVs are already committed to projects in Asia and Europe over the middle of the decade. In terms of the specialist WFIV fleet of six vessels, five already have commitment in Europe and Asia. In summary, turbine and foundation capable installation capacity becomes a potential bottleneck over the middle of the decade for US and international projects – and can lead to increased costs and/or project delays.
In the same way that high-end supply of turbine and foundation installation capacity will be at a premium when US project developers will be building their projects, the cable lay vessels and barges required for inter-array cabling and connecting the wind farms to shore will also be in short supply. Again, the lack of Jones Act vessels is an issue – a foreign flag vessel needs to be able to sail to the US with enough cable onboard to avoid having to return to a factory or supply point to restock with cable. Due to the size of US projects, the size of cable lay vessel will need to be large. There will only be around 25 of these large cable layers globally in 2024 – the point where international demand will exceed supply. This will drive the deployment of less efficient cable laying barges and small cable lay vessels– and can lead to increased costs and/or project delays.
As with offshore oil and gas projects, a significant amount of lifetime project cost in an offshore windfarm is represented by routine planned operations and maintenance. For an offshore windfarm this is typically 40-45% of the lifetime cost. Our forecast identifies around $4.8bn of annual recuring OPEX once the identified projects are commissioned.
Wind farm operators will set routine inspection and maintenance schedules, chartering in long-term vessel support for the activities. The tonnage will be mostly Jones Act vessels. Certain vessel categories can be modified/redeployed for the existing Jones Act fleet. Other requirements call for new buildings. We forecast a long-term demand of around 30 service operations vessels (SOVs) and crew transfer vessels (CTVs) – the demand for which is analyzed in our report.
Offshore Wind Going Forward
States are continuing to discuss with federal agencies the development of future offshore wind activity.
In the coming years, we expect to see new federal leasing activity in the Atlantic, Pacific, and possibly the Gulf of Mexico. We also anticipate further investigation by states of the potential in the Great Lakes.
Competitive floating wind solutions will be required to open the potential off the continental and Hawaiian Pacific coasts.
But significant challenges remain to be addressed for both bottom-fixed and floating wind technologies if the US is to deliver on its ambitions.
Details off all the projects in the forecast are provided in our report.
For more information, please visit www.worldenergyreports.com or contact
Rob Howard at +1 561 732 4368 or Philip Lewis at +44 203-966-2492
About the Author:
Philip Lewis is Director Research at World Energy Reports/International Maritime Associates. He has extensive market analysis and strategic planning experience in the global energy, maritime and offshore oil and gas sectors.