Market Report
U.S. Offshore Wind
2021: The Year When Offshore Wind Takes Off in the United States
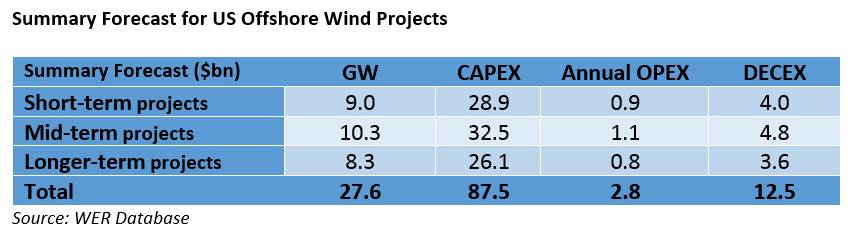
As of mid-March 2021, there were at least 30 offshore wind projects in the planning stage representing an $87.5bn CAPEX and $2.8bn annual OPEX opportunity thatare forecast to be developed within this decade.
By Philip Lewis IMA/WER
After several false starts, 2021 is the year when the offshore wind industry begins to realise its potential. At least 30 offshore wind projects are forecast to be developed within this decade. Ports, fabricators, component manufacturers, vessel operators, engineering firms and lenders will benefit from the $87.5bn CAPEX, $2.8bn annual OPEX, and $12.5bn DECEX opportunity.
Despite being the 2nd largest global market for onshore wind, the United States is today a minor player in offshore wind in comparison to the European and Asian offshore wind markets. Two operational projects for a total 42MW of installed capacity were installed in the USA at the end of 2020 versus a global offshore installed base of 34GW.
2021 will deliver a step change in offshore wind activity in the US as the journey accelerates to develop the 27.6GW project pipeline within this decade.
These are the findings shared in a recent report on the US offshore wind market in this decade by World Energy Reports (WER).
The 170+ page report examines the business conditions likely to drive offshore wind project development in the US within this decade, forecasts the number, CAPEX, OPEX and timing of projects, and provides a roadmap to accessing these market opportunities.
Offshore Wind Overview
From the first eleven 450kW WTG 5MW Vindeby Windfarm, commissioned in 1991 in Denmark, offshore wind has grown to reach 34GW cumulative installed capacity by the end of 2020 provided by 18 countries.
Europe has played the leading role to date, accounting for 73% of capacity and a significant industrial base for wind farm component manufacture and logistics capabilities.
China has recorded a surge in capacity since 2015 to reach 23% of global capacity by the end of 2020.
The largest three markets at the end of 2020, the UK, China, and Germany, accounted for ~78% of global installations.
Whereas the European, Chinese, Taiwanese, and Vietnamese markets will continue to remain strong throughout the decade, we expect to welcome South Korea, Japan, and the USA to the stage of global scale players within this decade.
In the mid- to long-term, we are tracking offshore wind projects in 38 countries.
As the industry matures in key markets, CAPEX and OPEX costs are falling making offshore wind more competitive.
Reducing from a global average $170/MWh in 2010, 2016 to 2018, European and US auctions have seen strike prices in the $60/MWh to $110/MWh range. The strike price represents the all-in-cost per MWh to develop an offshore wind project. It reflects the guaranteed revenue for the operator.
US wind projects will enjoy some of the costs benefits achieved from the growth of the European offshore wind industry. The utility scale projects due to come online over the coming five or so years in the United States will generate revenue in a range of $70/MWh to $137MWh. These pricing levels have been reached much earlier than has been seen in the European and Taiwanese industry.
One of the drivers for offshore wind cost reduction is the development of larger turbines, which help to reduce overall foundation, cable, and maintenance costs. Projects in the US will mostly deploy the largest commercially available turbines.
Offshore Wind in the United States
The current US nameplate power generation capacity is ~1,200GW. The US DOE’s NREL has quantified the offshore wind net commercially feasible resource at 2,060GW. This is almost two times today’s total electricity generation capacity. Wind resource is available in 29 states along the Atlantic, Pacific, Gulf of Mexico, and Great Lakes coasts.
This decade will see utility scale projects in the relatively shallow and near shore waters of the northeast and mid-Atlantic. These projects will mainly adopt the bottom-fixed solutions found in the established European and East Asian markets.
We are also forecasting the demonstration of offshore wind technology in the Great Lakes and two floating wind pilots in the Atlantic within the decade.
The Main Players
Around 90% of the identified commercially feasible offshore wind potential is in federal waters. One offshore wind project, the Coastal Virginia pilot, is operational in federal waters.
The main federal agency, BOEM, is reviewing construction and operations permits for 11 projects for 9GW. The approval of the first of these projects, Vineyard, has been significantly delayed due to the extended environmental impact assessment review process.However, it is expected that Vineyard will receive construction and operations approval within the first half of this year. This in turn will unblock the queue of project seeking review and approval. A further 9 projectsfor 10.3GW are preparing their applications for construction and operations approval and another 8 projects for 8.3GW are assessing and surveying the sites to establish construction and operations plans.
It is the states who drive demand through policies targeting renewable energy procurement. 30.5GW of specific offshore wind procurement targets have been announced and close to an additional 1.4GW of procurement commitments have been made.
A group of 16 developers will deliver the project forecast. This group include leading European developers, renewable energy asset investment companies, US utilities and European oil & gas companies.
A 27.6MW Project Forecast
As of March 2021, there are 11 projects for 9GW in the federal construction and operations review queue. These should be the first projects to receive approval and move to the construction phase in the short-term. We are forecasting most of this capacity to come on stream between 2023 and 2027.
The mid-term forecast represents those projects that are undertaking site assessment work and are expected to start submitting construction and operations plans for review and approval within this year. Developer planning indicates commissioning of these projects between 2025 and 2030. Given the current federal permitting review delays, we anticipate some movement on these commissioning dates.
The longer-term forecast brings together projects on secured federal leases that are at earlier stages of site assessment. These all need to be commissioned before 2035 to meet state procurement targets.
It should be noted that the current identified projects will not deliver enough capacity to meet northeast and Mid-Atlantic state procurement targets by 2035. More project capacity will be identified from existing federal leases and from new Atlantic leasing activity, expected to be rolled at the end of this year or early next year.
A $87.5bn CAPEX and Annual $2.8bn Opportunity
Our bottom-up forecast model breaks the $87.5bn of CAPEX into component spend. We are forecasting close to $60bn to be spent on material supply, manufacturing and/or fabrication of turbines, cables, foundation structures and other equipment.
We anticipate around $25bn will be spent on installation and commissioning activities. The Jones Act supports US built, owned, and operated vessels. This means that foreign flag installation vessels will not be able to shuttle components from US ports to the construction site, as is the practice in the developed European and East Asian markets. There is limited Jones Act compliant turbine, foundation, and cable installation capacity. This can lead to project delays or increased costsas developers compete for scarce foreign flag tonnage and comparatively high-priced Jones Act new buildings or select less efficient/cost competitive combinations of foreign flag installation vessels and domestic feeder vessels.
There will be a significant investment in US port infrastructure because of offshore wind developments. Around 50 ports along the northeast and Mid-Atlantic coast have been identified as potential candidates to support construction and marshalling activities. Over $1bn of investment commitments have already been identified.
As with offshore oil and gas projects, a significant amount of lifetime project cost in an offshore windfarm is represented by routine planned operations and maintenance. For an offshore windfarm this is typically 40-45% of the lifetime cost. Our forecast identifies around $2.8bn of annual recuring OPEX once the identified projects are commissioned.
Wind farm operators will set routine inspection and maintenance schedules, chartering in long-term vessel support for the activities. The tonnage will be mostly Jones Act Vessels. Certain vessel categories can be modified/redeployed for the existing Jones Act fleet. Other requirements call for new buildings.
Offshore wind going forward
States are continuing to discuss with federal agencies the development of future offshore wind activity.
In the coming years, we expect to see new federal leasing activity in the Atlantic and Pacific. We also anticipate further investigation by states of the potential in the Great Lakes.
Competitive floating wind solutions are certainly required to open the potential off the continental and Hawaiian Pacific coasts. But many are often surprised to learn that the first floating projects in the US will be in the Atlantic. In terms of technology development, our project forecast already includes two floating offshore wind demonstration projects to be commissioned off the Atlantic Coast.
Details off all the projects in the forecast are provided in our report.
Philip Lewis
Philip Lewis is Director Research at World Energy Reports/International Maritime Associates. He has extensive market analysis and strategic planning experience in the global energy, maritime and offshore oil and gas sectors.