By the Numbers
Inland Infrastructure
By the Numbers: America’s Inland Waterways at a Breaking Point
If you want to understand the state of the U.S. inland waterways system, don’t start with rhetoric. Start with the numbers. A new study commissioned by Waterways Council, Inc. (WCI) lays them out plainly—and they paint a picture of a system that remains indispensable to the U.S. economy, but increasingly fragile, expensive to fix, and slow to modernize
25,000 Miles
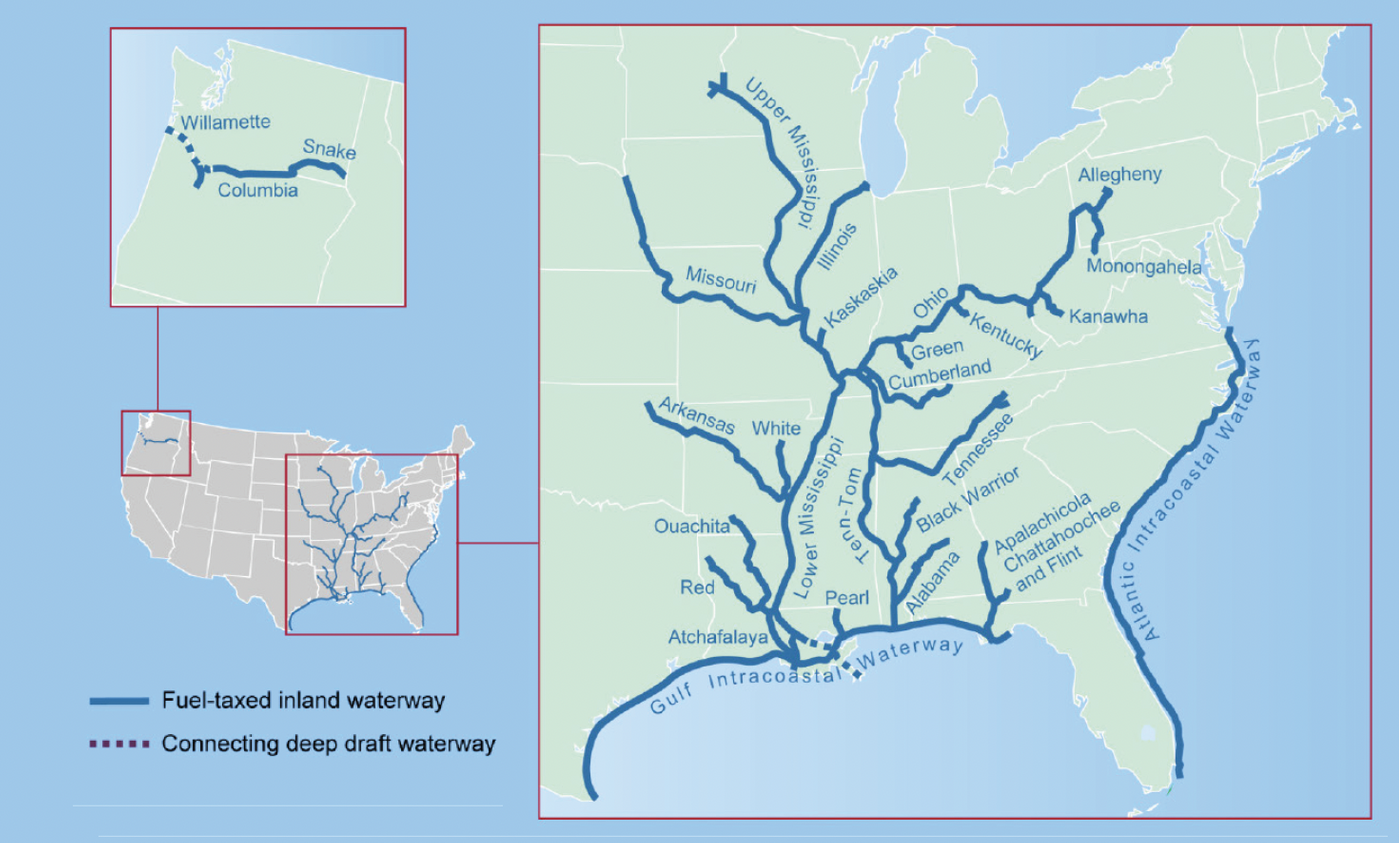
That’s the estimated length of the nation’s navigable waterways—coastal and inland combined. Of that, roughly 12,000 miles are actively maintained by the U.S. Army Corps of Engineers (USACE), and about 11,000 miles are part of the fuel-taxed inland waterway system that commercial operators rely on daily.
-
Why it Matters: This system quietly moves America’s bulk economy—grain, coal, petroleum, aggregates, chemicals—at a scale no other mode can match. When it hiccups, supply chains don’t just slow down; they feel it in higher costs and missed deliveries.

218 Lock Chambers
Spread across 176 sites, these are the mechanical choke points that keep commerce moving. They’re also the weakest links.
-
Why it Matters: Nearly 80% of these lock chambers are more than 50 years old, and more than 35% are over 80 years old—well beyond their original 50-year design life. Aging infrastructure means more unplanned outages, more congestion, and more uncertainty for operators trying to schedule tow movements with precision.
70 Years
That’s the average age of inland lock and dam infrastructure. Put another way: much of this system was designed when Eisenhower was president, barge sizes were smaller, and reliability expectations were far more forgiving.
-
Why it Matters: Today’s system is being asked to move more cargo, more efficiently, with less tolerance for failure — on infrastructure never designed for that level of demand.

10 Projects Since 1987
Only 10 lock modernization or expansion projects have been completed in nearly four decades.
Seven of those began construction in the late 1980s and wrapped up in eight years or less, with average cost overruns of 33%. But the more recent track record tells a different story.
-
Why it Matters: Over the last 28 years, just three projects have been completed, and they’ve taken dramatically longer and cost dramatically more.
26 Years
That’s how long it took to complete the Olmsted Locks and Dam, finished in 2018. Originally expected to be a far more modest investment, Olmsted ultimately saw a 275% cost increase over its initial estimate.
-
Why it Matters: Olmsted Locks and Dam has become the poster child for what happens when complex inland navigation projects collide with uncertain funding, shifting requirements, and outdated delivery models.
$875 Million Per Year
According to the report, that’s the estimated annual cost of delayed benefits to commercial barge traffic when new locks are late coming online.
-
Why it Matters: Every year of delay means higher transportation costs, reduced efficiency, and ripple effects across agriculture, energy, and manufacturing. These aren’t abstract numbers; they show up in freight rates and, eventually, consumer prices.
29 Cents
That’s the fuel tax paid per gallon by commercial barge operators into the Inland Waterways Trust Fund (IWTF), the industry’s direct contribution to maintaining and modernizing the system.
-
Why it Matters: In FY 2024, the IWTF collected $123 million, which, when matched with general treasury funds, made nearly $500 million available for future appropriations. The money is there, but the report makes clear that how it’s programmed and deployed matters just as much as how much is collected.
54 Continuing Resolutions
Since 2010, USACE has operated under 54 Continuing Resolutions, creating persistent uncertainty around when, not if, funding will be available.
-
Why it Matters: That uncertainty makes it difficult to plan multi-year construction projects efficiently. Contractors hesitate, schedules stretch, and costs climb. Large, billion-dollar projects simply don’t lend themselves to stop-and-go funding.
275% to Nearly 600%
That’s the range of cost increases seen on several major lock projects highlighted in the report, including Kentucky Lock and Chickamauga Lock.
-
Why it Matters: The takeaway isn’t finger-pointing. It’s structural. The report argues that inland waterways are still treated as isolated projects rather than as an integrated national system—leading to fragmented planning, inconsistent priorities, and avoidable cost growth.
The Big Number That Matters Most
The report’s core recommendation is simple: treat inland waterways as a system, not a collection of individual projects.
Programmatic funding, standardized designs, alternative contracting methods, and centralized expertise aren’t flashy ideas—but the numbers suggest they may be the only way to stop costs from ballooning and schedules from slipping further.
For an industry that depends on reliability, predictability, and scale, the message is clear. The inland waterways still deliver enormous value. But without systemic change, the math is headed in the wrong direction.
Source: Waterways Council, Inc., “Recommendations for Improving the Delivery of Inland Waterway Capital Projects”
Need more information on how inland infrastructure impacts maritime ops?
Waterways Council Inc.
Jen Armstrong
